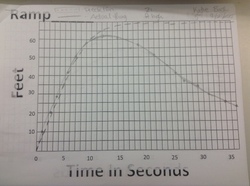
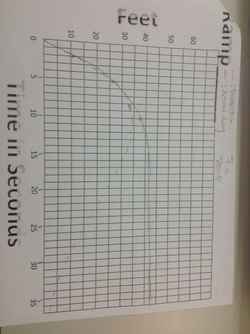
My predictions were pretty close to the actual graph. My prediction for the 27 inch ramp was off because I thought that the skateboard would stay in the same place after it lost all of its momentum. The 14 inch ramp prediction was closer to the actual graph, though I predicted a more gradual decline after the loss of the initial forward momentum.The 7 inch ramp prediction was also fairly close, I got the least forward momentum part correct but I did not predict the skateboard to stay in the same place when it lost its forward momentum.
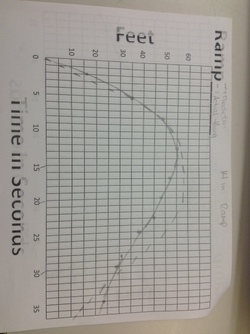
The zeros represent the time before the skateboard moved. The zeros the three graphs are all the same. In terms of maximums the 21 inch ramp had the highest maximum, the 14 inch had the second biggest and the 7 inch had the smallest maximum. None of the graphs had a minimum value.The graphs were quite similar, there is a correlation between how high off the ground the skateboard is and the highest point on the graph. The difference between the graphs is the 21 and 14 inch graphs moved backwards when it reached its highest point but the 7 inch ramp skateboard did not go backwards after it reached its maximum point. When a graph rises the fastest it means it had more momentum than the other graphs. If the graph increases the fastest it would make sense that it would be the fastest to decrease the fastest, because for every action there is a equal and opposite reaction.
 RSS Feed
